Hands-On Observability
Introduction
In Kubernetes, containerized applications are deployed on pods, which are dynamically created on virtual groups or clusters called namespaces. Because Kubernetes decouples developers and operations from deploying to specific machines, it significantly simplifies day-to-day operations by abstracting the underlying infrastructure. However, this results in limited control over which physical machine the pods are deployed to.
You will see how AppDynamics provides visibility into the infrastructure inter-dependencies.
Use the credentials used previously to login to the AppDynamics controller if you’ve been logged out.
Cluster Agent on IKS
Use the steps below to explore the cloud native visibility the AppDynamics cluster agent provides for the IKS Kubernetes cluster.
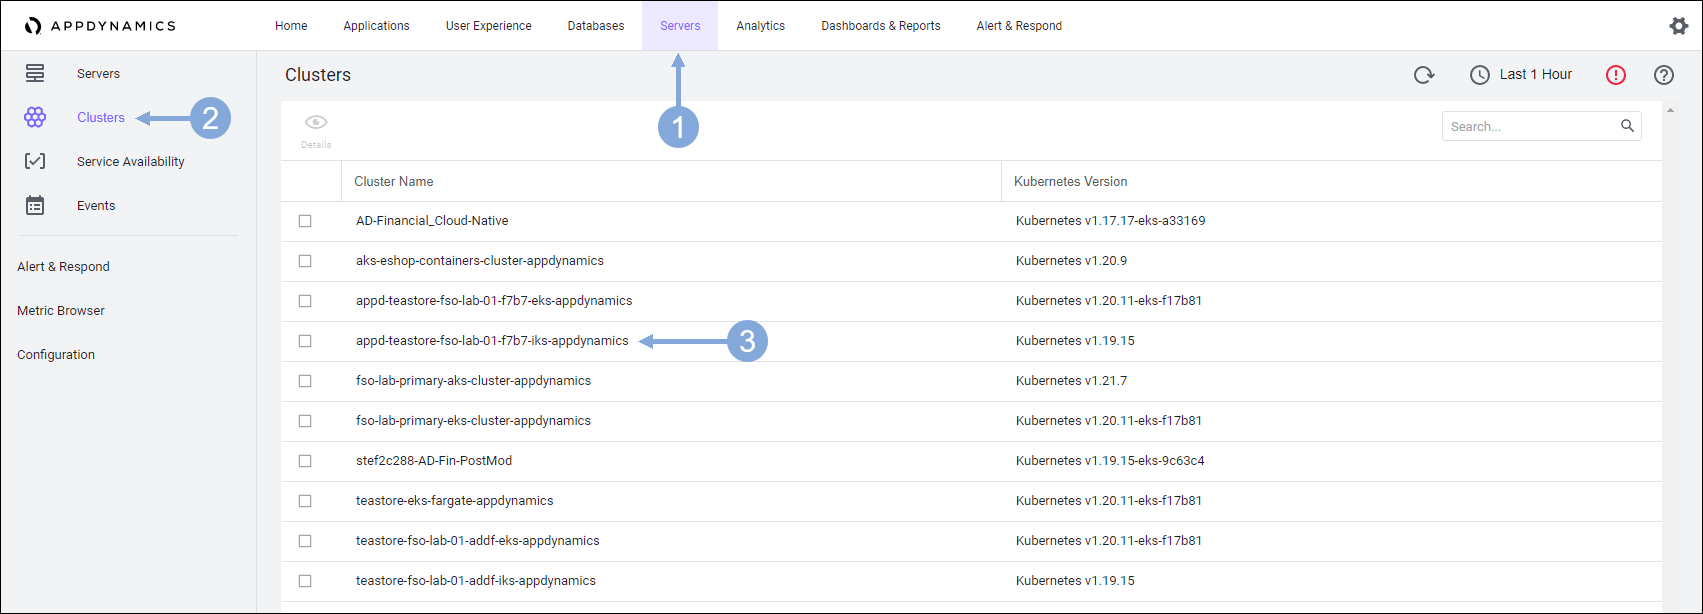
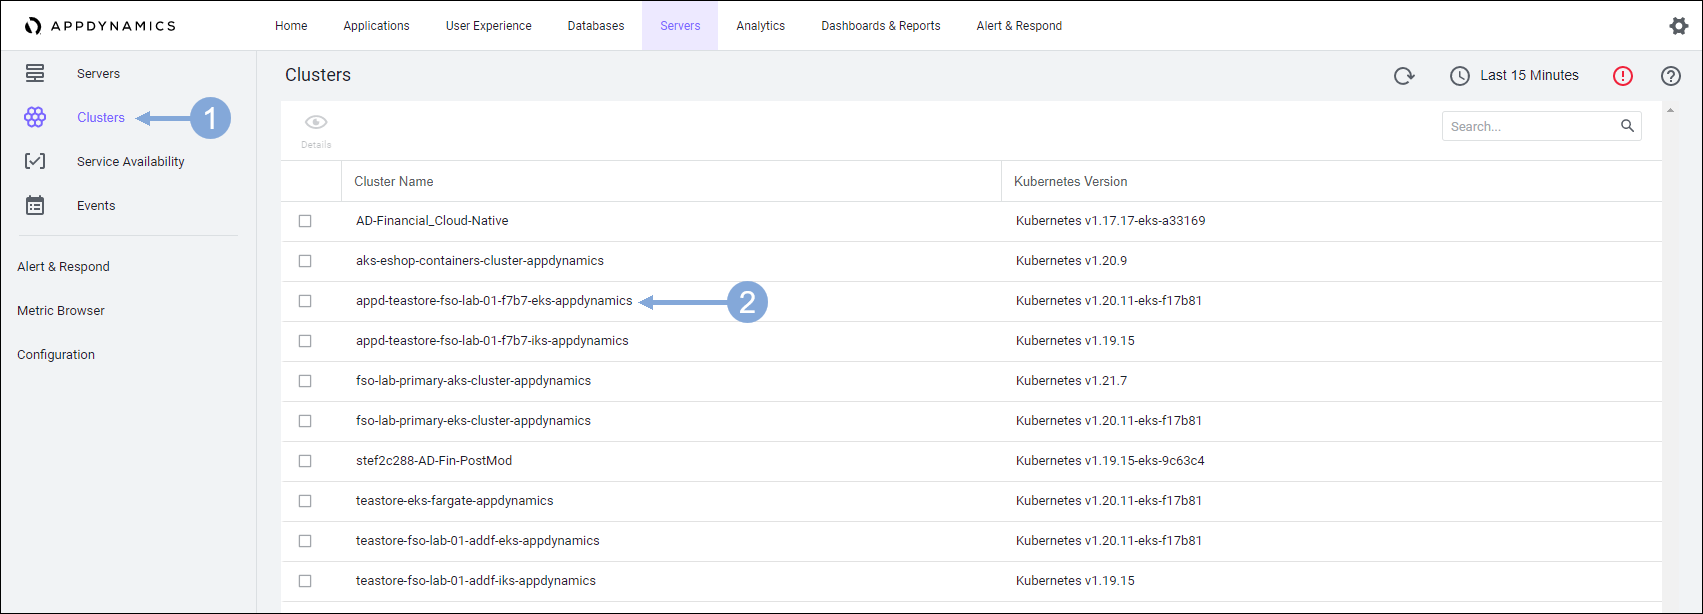
- Click on the Servers tab on the top menu
- Click on the Clusters menu option on the left
- Find the IKS cluster name that starts with appd-teastore-fso-lab-{your-lab-number} and contains iks and double-click on its name
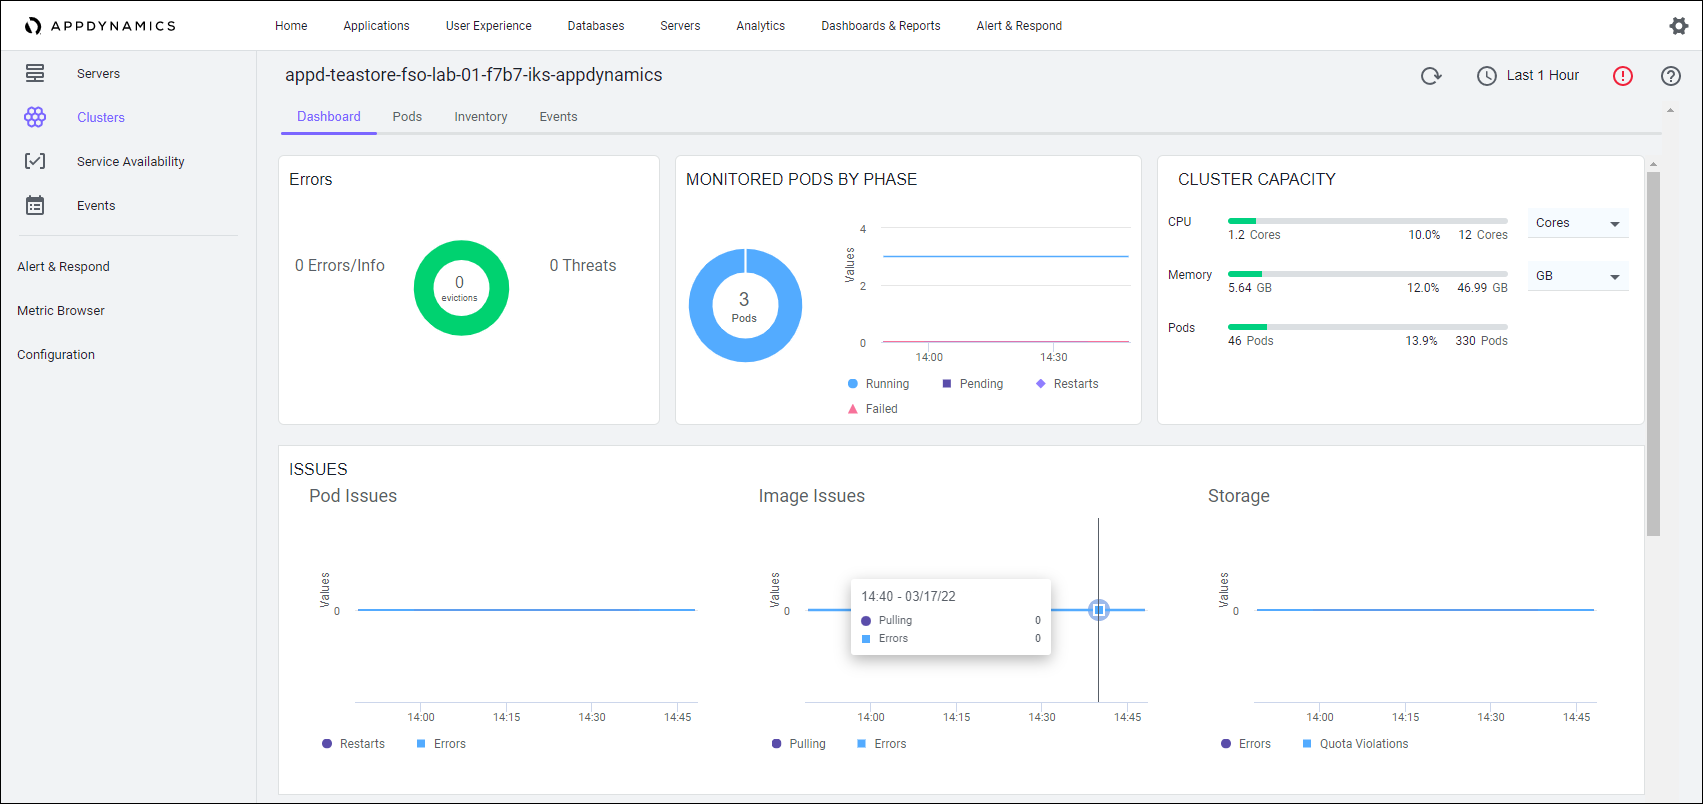
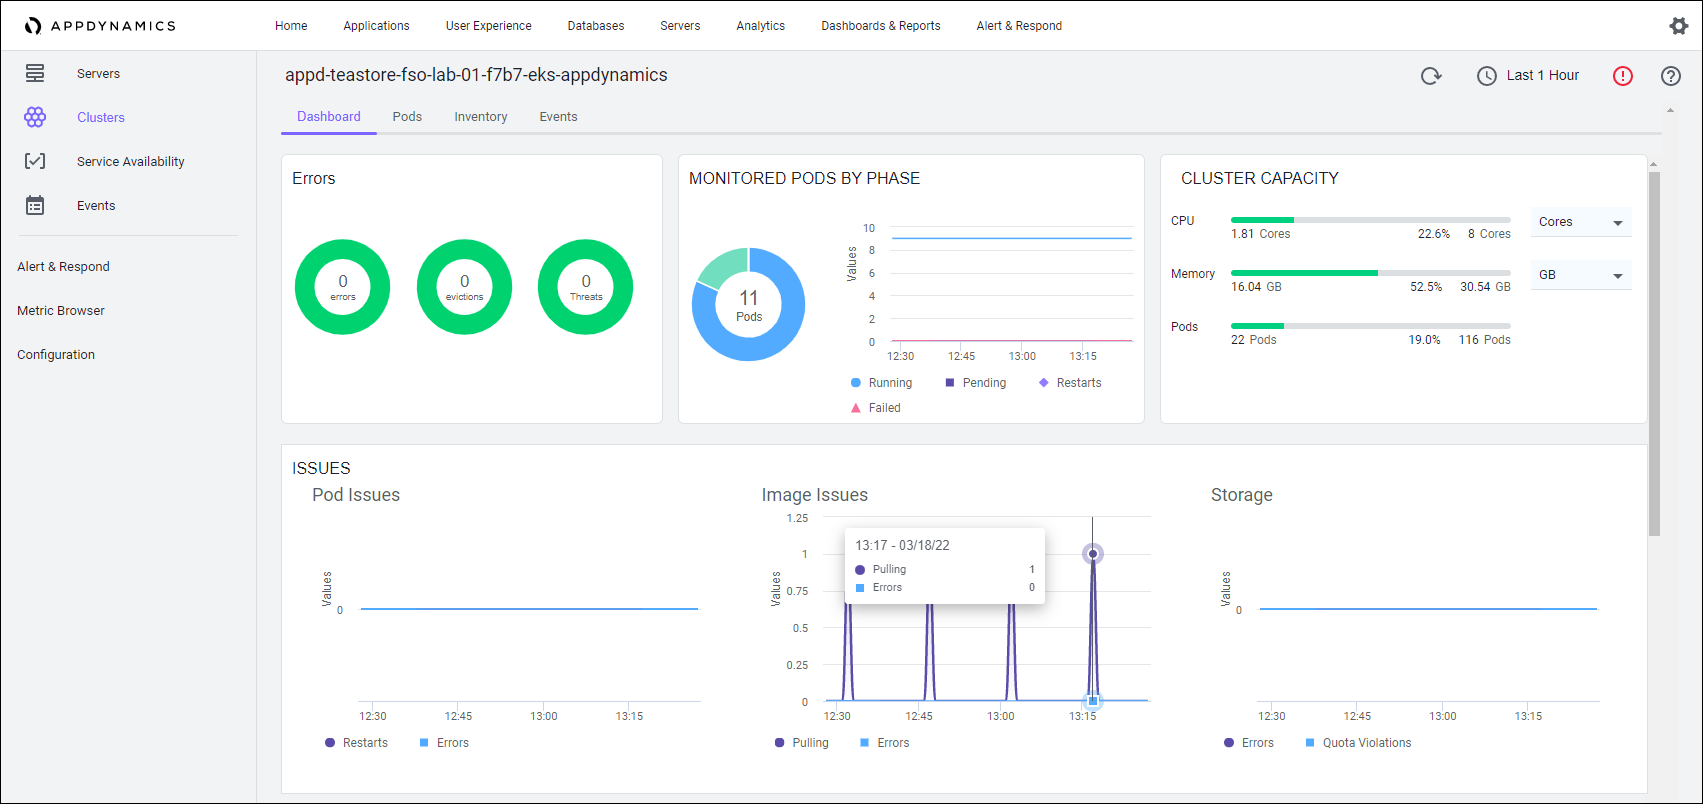
In the display you can see the following information.
- Cluster capacity by CPU cores, CPU millicores, memory megabytes, or memory gigabytes
- The number of errors that occurred on the cluster
- The number of pods currently running
- CPU utilization
- Quotas set for memory the utilization compared to the quota
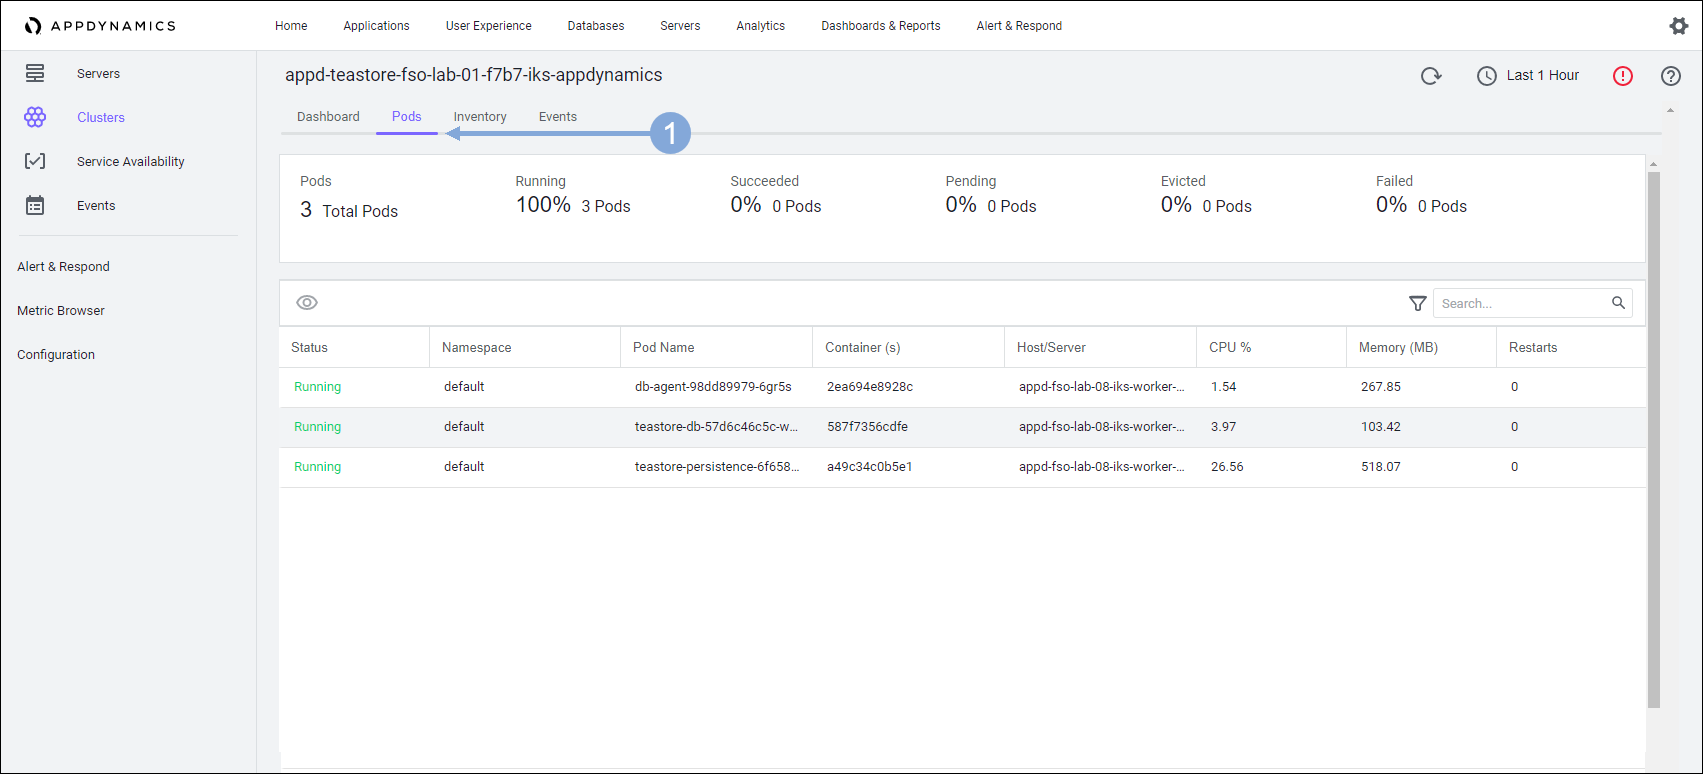
At the top of the display click Pods.
You can see the status of the individual pods. Scrolling down the page, you can see the pod for teastore-persistence. This sortable list, provides information about the pods associated with the application so you can quickly see the status and the utilization of every pod.
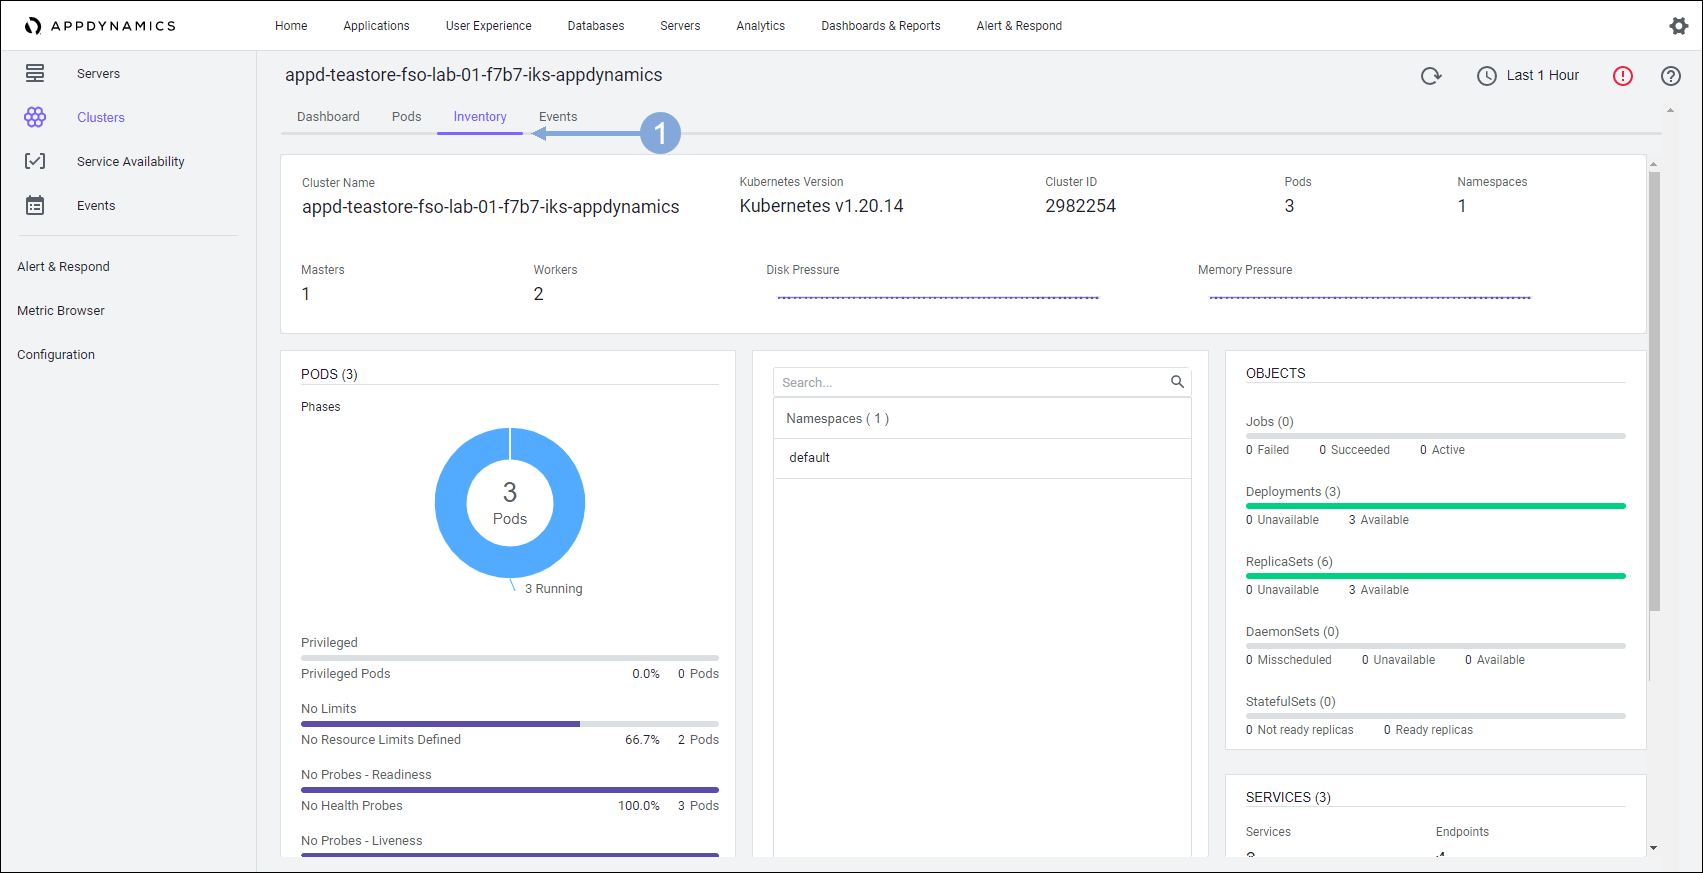
At the top of the display click Inventory.
You can see what is running in the cluster from a namespace perspective in this display. You will also see whether any jobs have failed, what the deployments look like, and any replica sets that exist. At a glance, you see the health of all the components of the cluster.
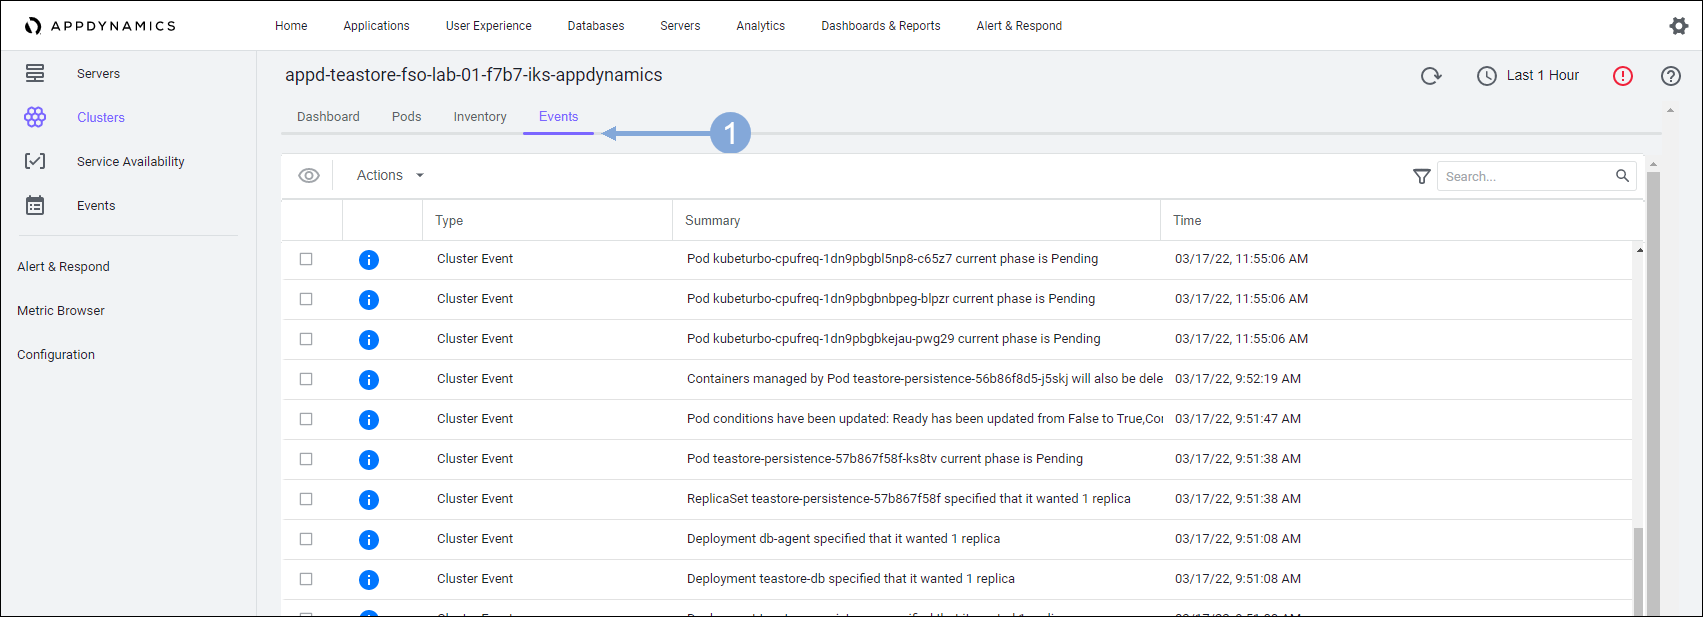
At the top of the display click Events.
Here we can see some info events in the IKS cluster (in some cases there may be no events in the IKS cluster). We’ll look at the EKS cluster next where we’ll see some interesting events.
Cluster Agent on EKS
Use the steps below to view the EKS cluster details.
- Click on the Clusters menu option on the left
- Find the EKS cluster name that starts with appd-teastore-fso-lab-{your-lab-number} and contains eks and double-click on its name
You get similar information as you did for the on-premise cluster. Notice that there are more pods getting reported for this cluster in the default namespace.
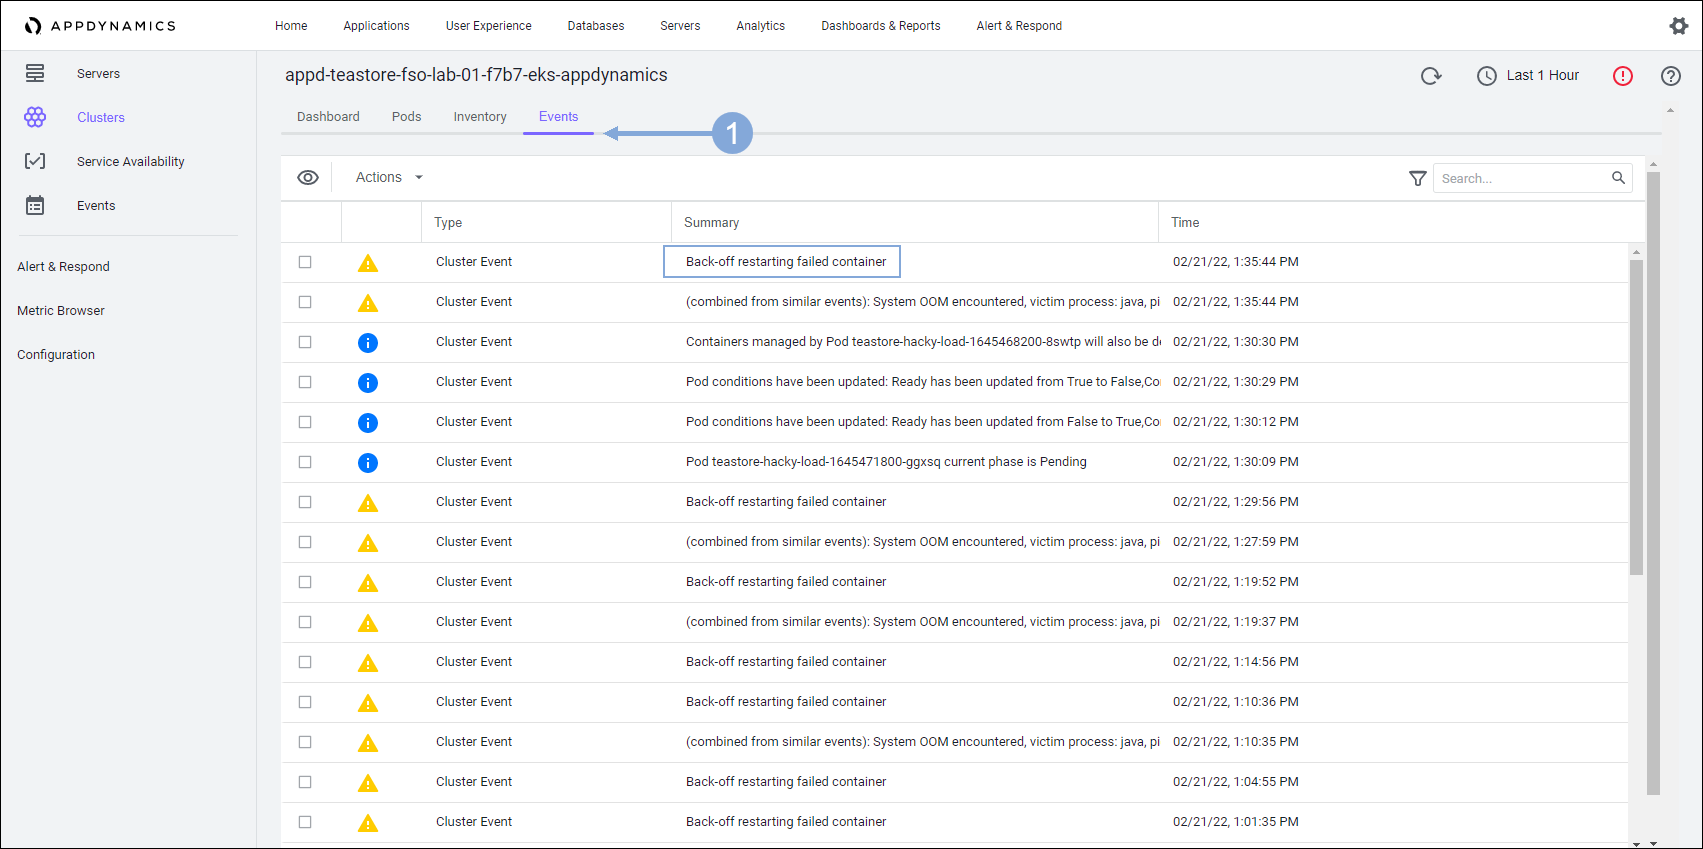
At the top of the display click Events.
You see the events that are contributing to problems with the application related to the pods. Near the top of the list you see that there is a failed container.
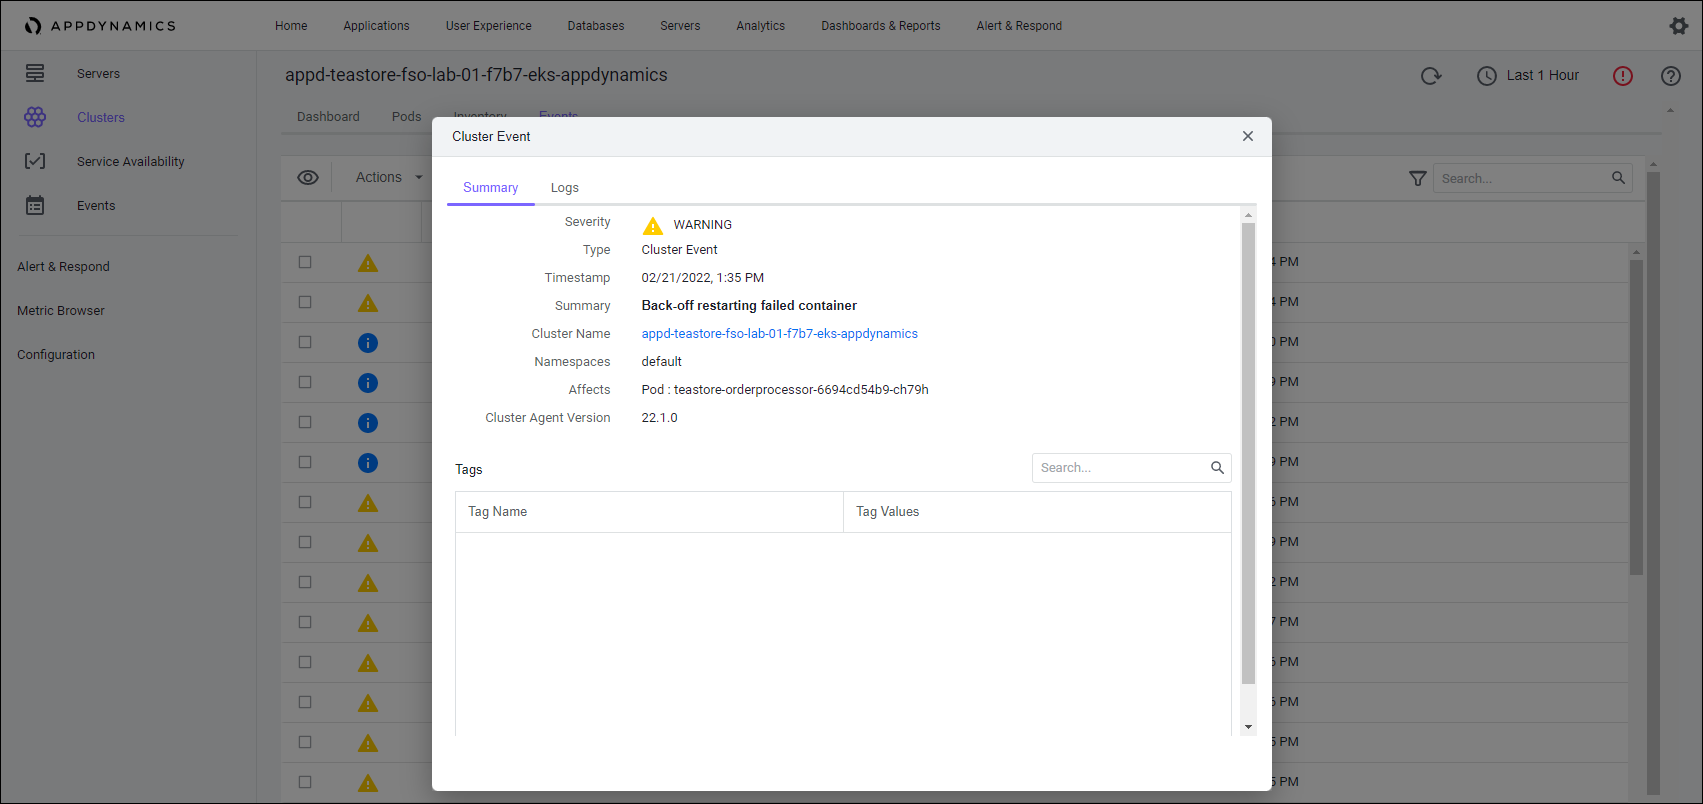
Double-click the first failed container event to display the summary of the event.
You can see when the event occurred, the cluster name, and which pod is affected. You can see the details of the log from this Cluster Event pop-up.
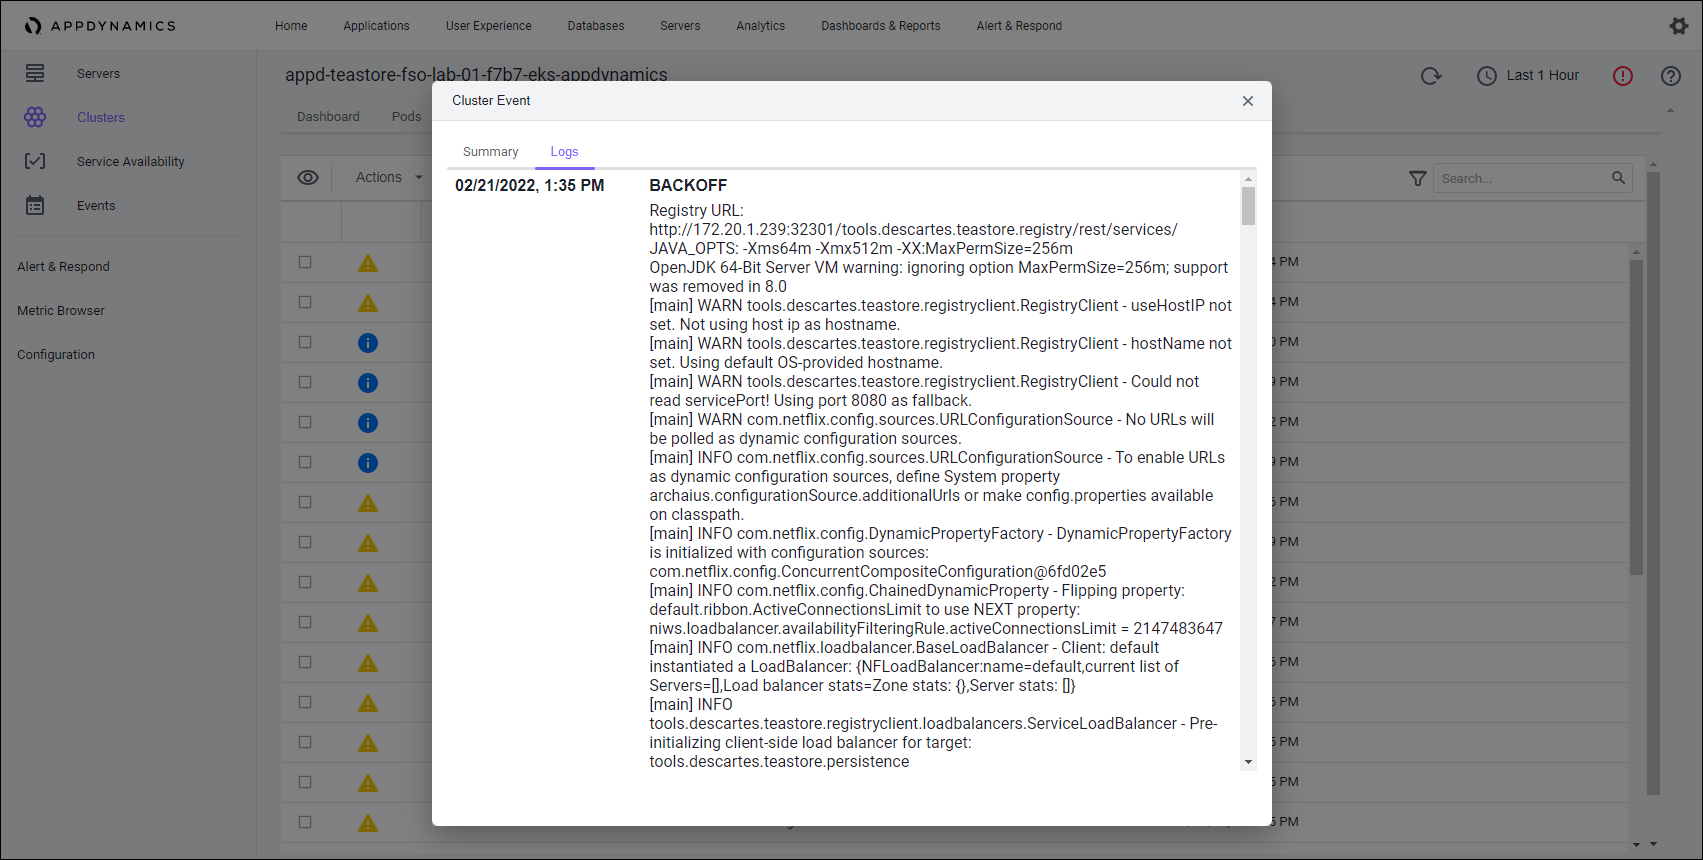
At the top of the pop-up, click Logs.
The full event log displays in the pop-up for your examination. Based on this information, you can take action to resolve the problem.
Next
We’ll look at the integration with ThousandEyes in the Customer Digital Experience Monitoring use case.