Hands-On Observability
Introduction
In this hands-on session, you’ll see Cisco’s Full-Stack Observability solution in a single dashboard monitoring the TeaStore hybrid application to determine what is affecting the performance to see the impact on revenue. The TeaStore application runs in a Hybrid-Cloud configuration. The application front-end is running in Kubernetes (EKS) in the cloud. The back-end, including the product database, is running on-premises in Kububernetes (IKS).
Use the credentials used previously to login to the AppDynamics controller if you’ve been logged out.
TeaStore FSO Dashboard
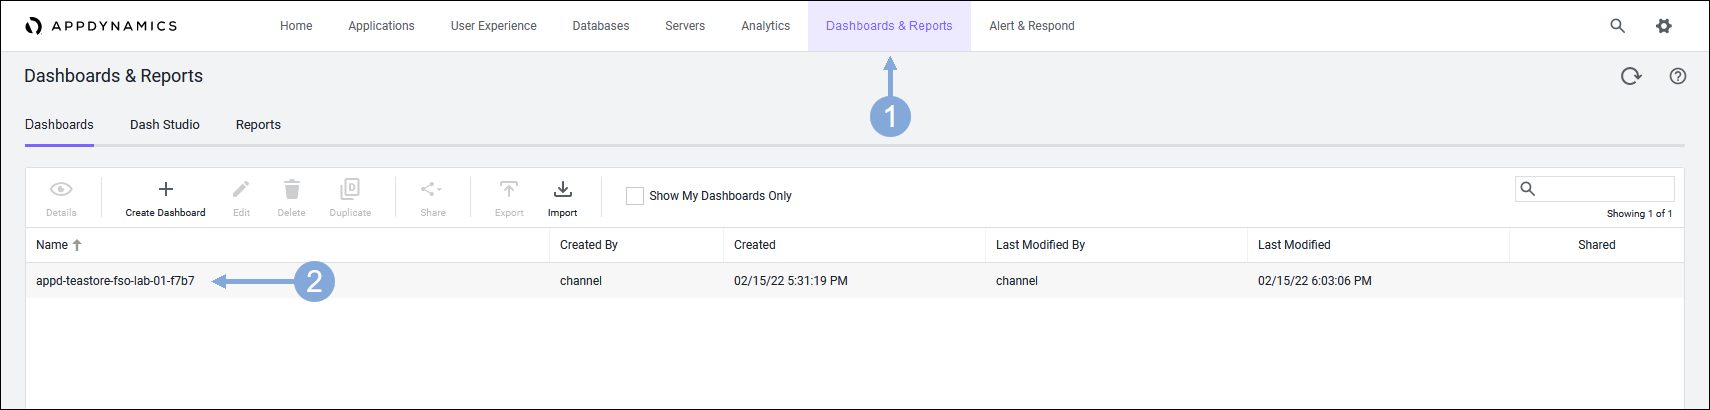
Open your TeaStore FSO Dashboard using the steps below.
- Click on the Dashboards & Reports tab on the top menu
- Double-click on the dashboard you see in the list (there should be only one)
Business Transaction Health
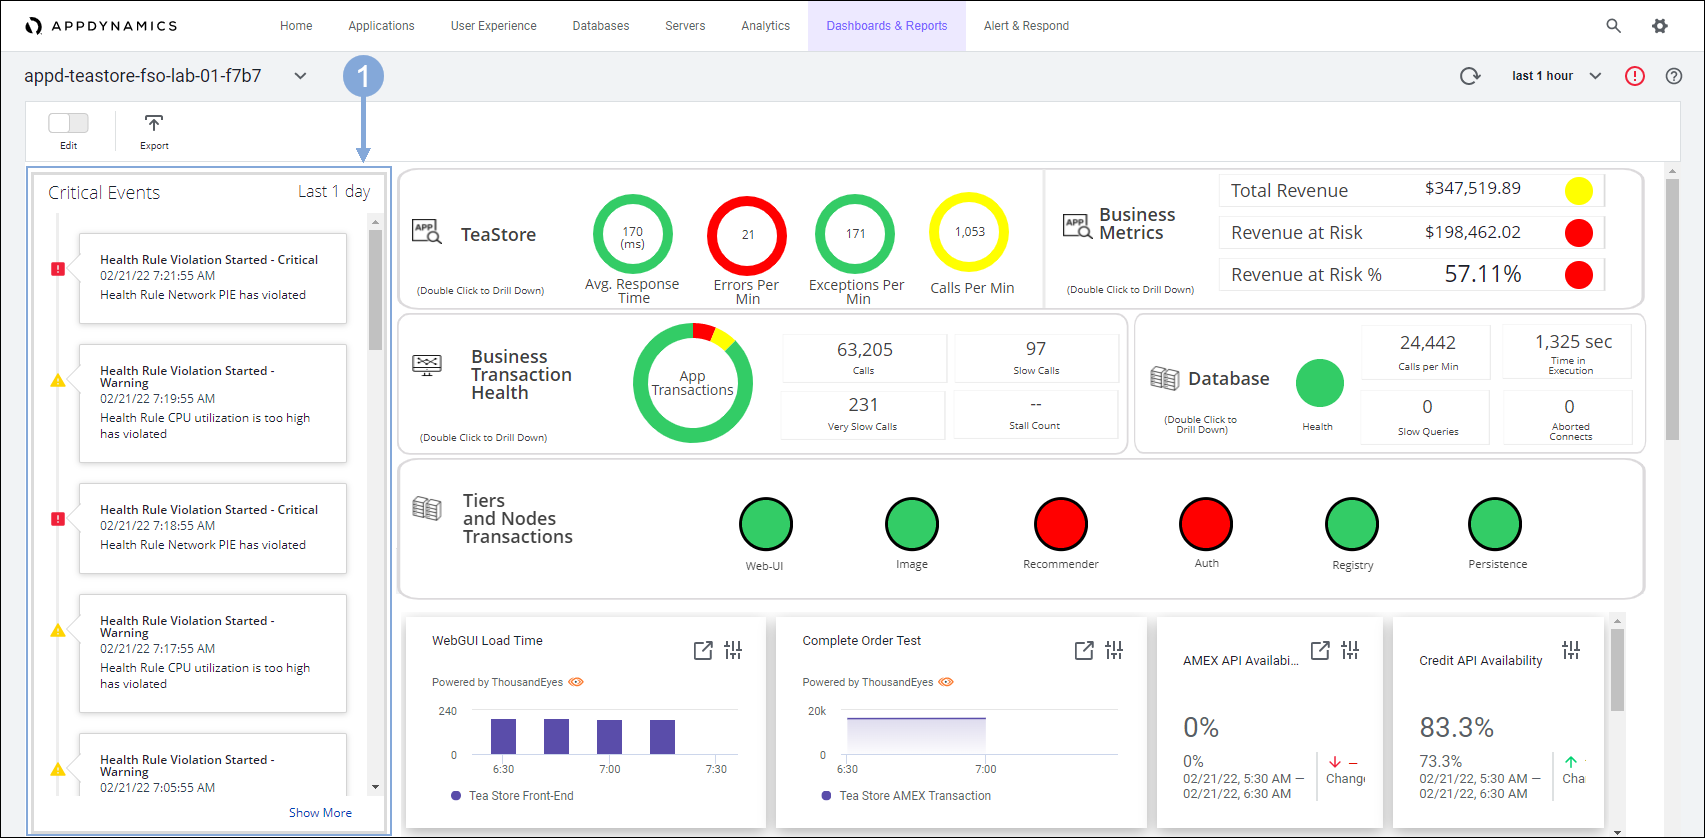
The application dashboard displays. Here in a single view you can see all the important metrics for the application, such as the Business Metrics, Business Transaction Health, Critical Events, and so on.
You can adjust the information presented on the dashboard by changing the Time drop-down at the top right of the dashboard. In this example, note that the displayed data is collated in the past hour.
Use the step below to explore business transaction health on your modified custom dashboard.
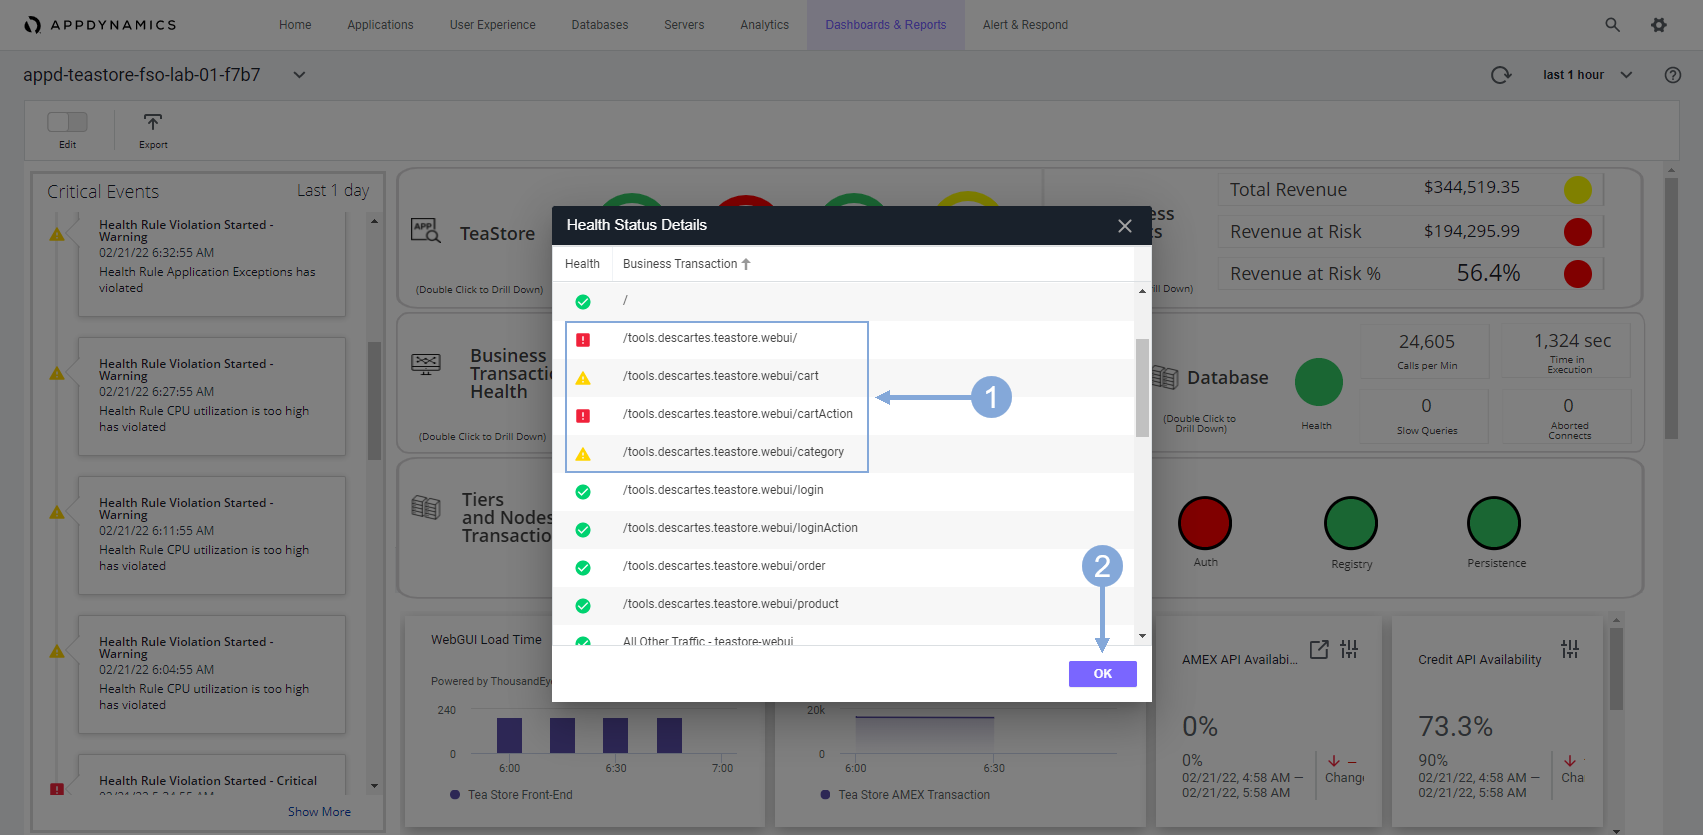
- Double-click on the App Transactions pie-chart to display the details of the transactions the end-users took in this time period
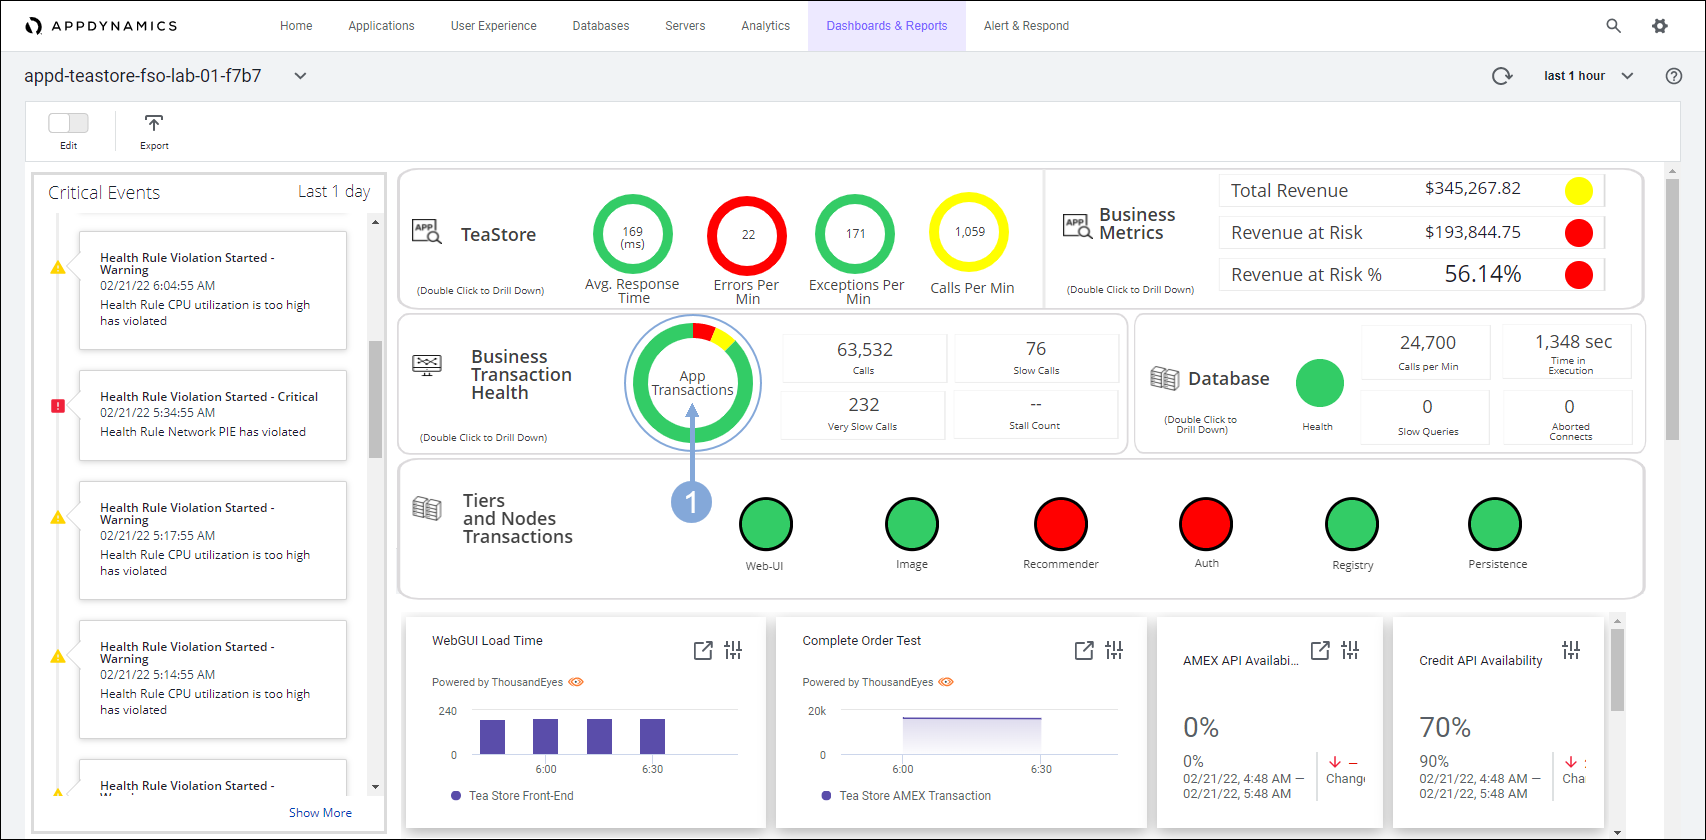
The transactions include logging in, viewing products, adding to the cart, and placing orders.
- Notice that some of the transactions are experiencing difficulties
- Click on the OK button when you have reviewed the transactions
Business Metrics
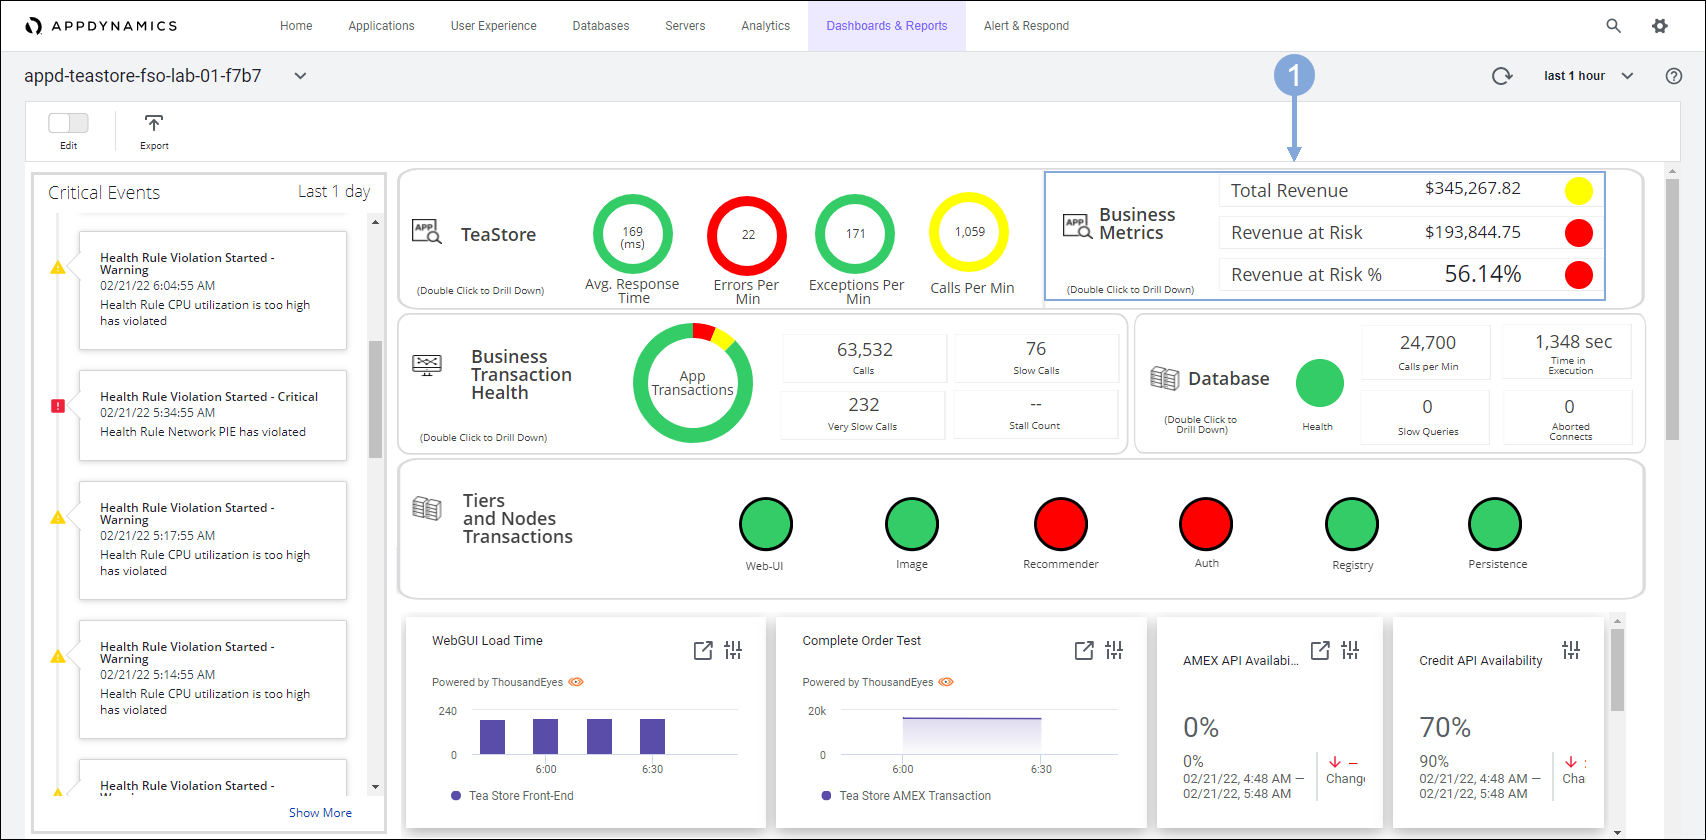
Examine the Business Metrics and note how the application performance impacts the revenue.
This area shows the potential revenue, but also indicates how the revenue is impacted by the current performance of the application. The Revenue at Risk % is high compared to the potential revenue, indicating that customers might be frustrated ordering products and might be abandoning orders.
This indicator is a cause for concern and requires further investigation. Before examining what may be causing the issue, you will look at some more details in this dashboard.
Critical Events
Look at the Critical Events section of the dashboard.
You see that there are some alerts recorded that are impacting the application. You can double-click any of the alerts to see more details about the alert.
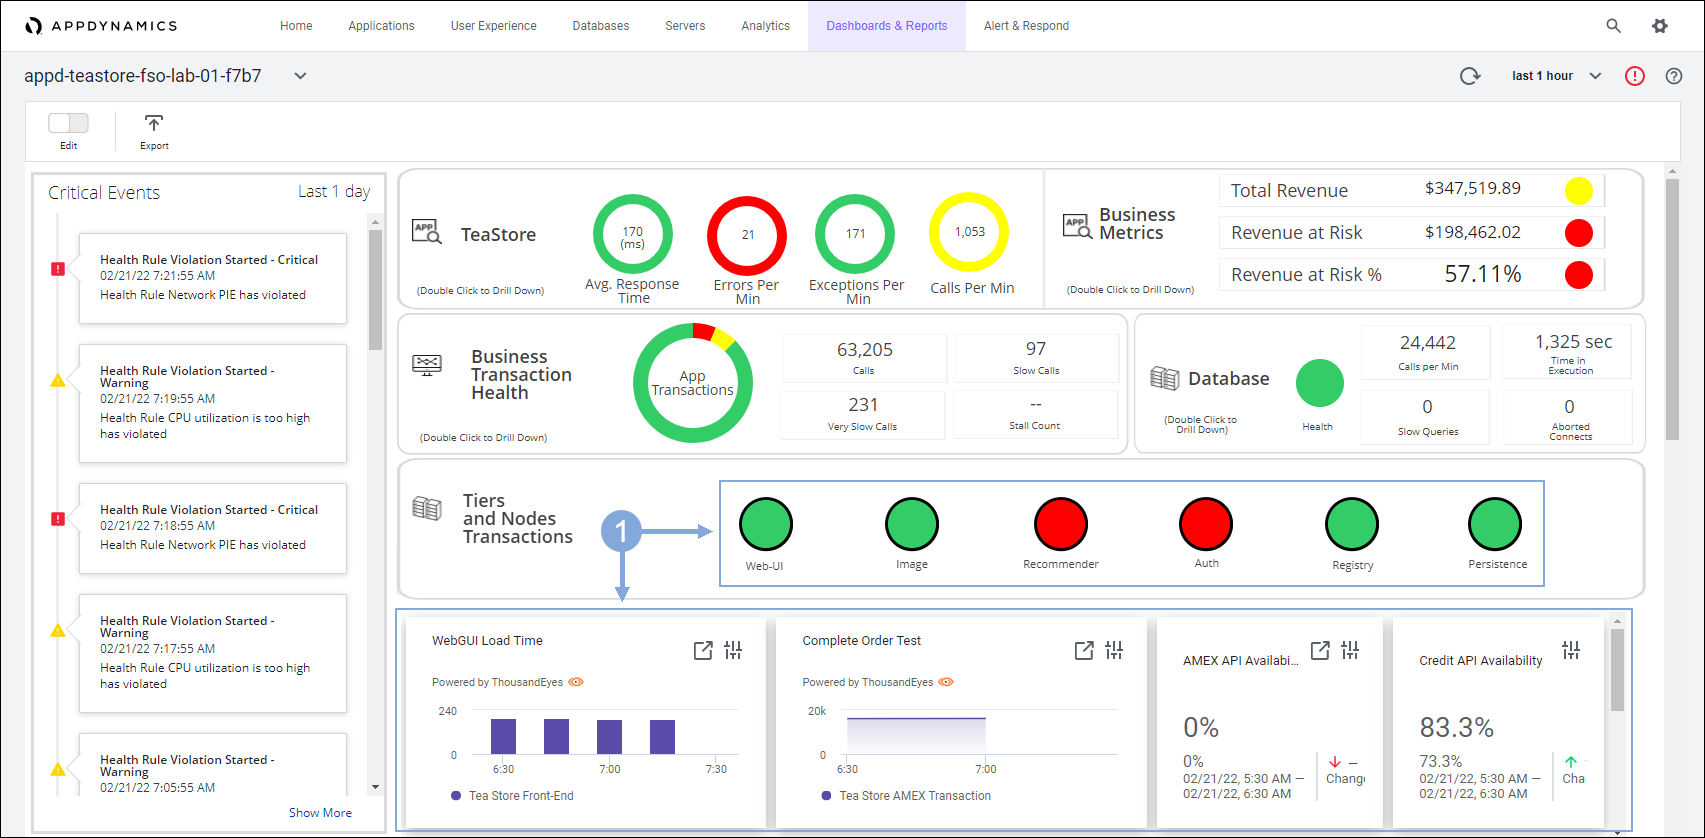
Tier and Node Transactions
Scroll to the section below Tiers and Node Transactions to see the key user interactions information.
This information includes how long it takes the application to load for the end-user, what is the average time to place an order, and what affect any third-party dependencies that are processing credit card payments have on the overall application performance. This information is pulled in from tests performed by ThousandEyes.
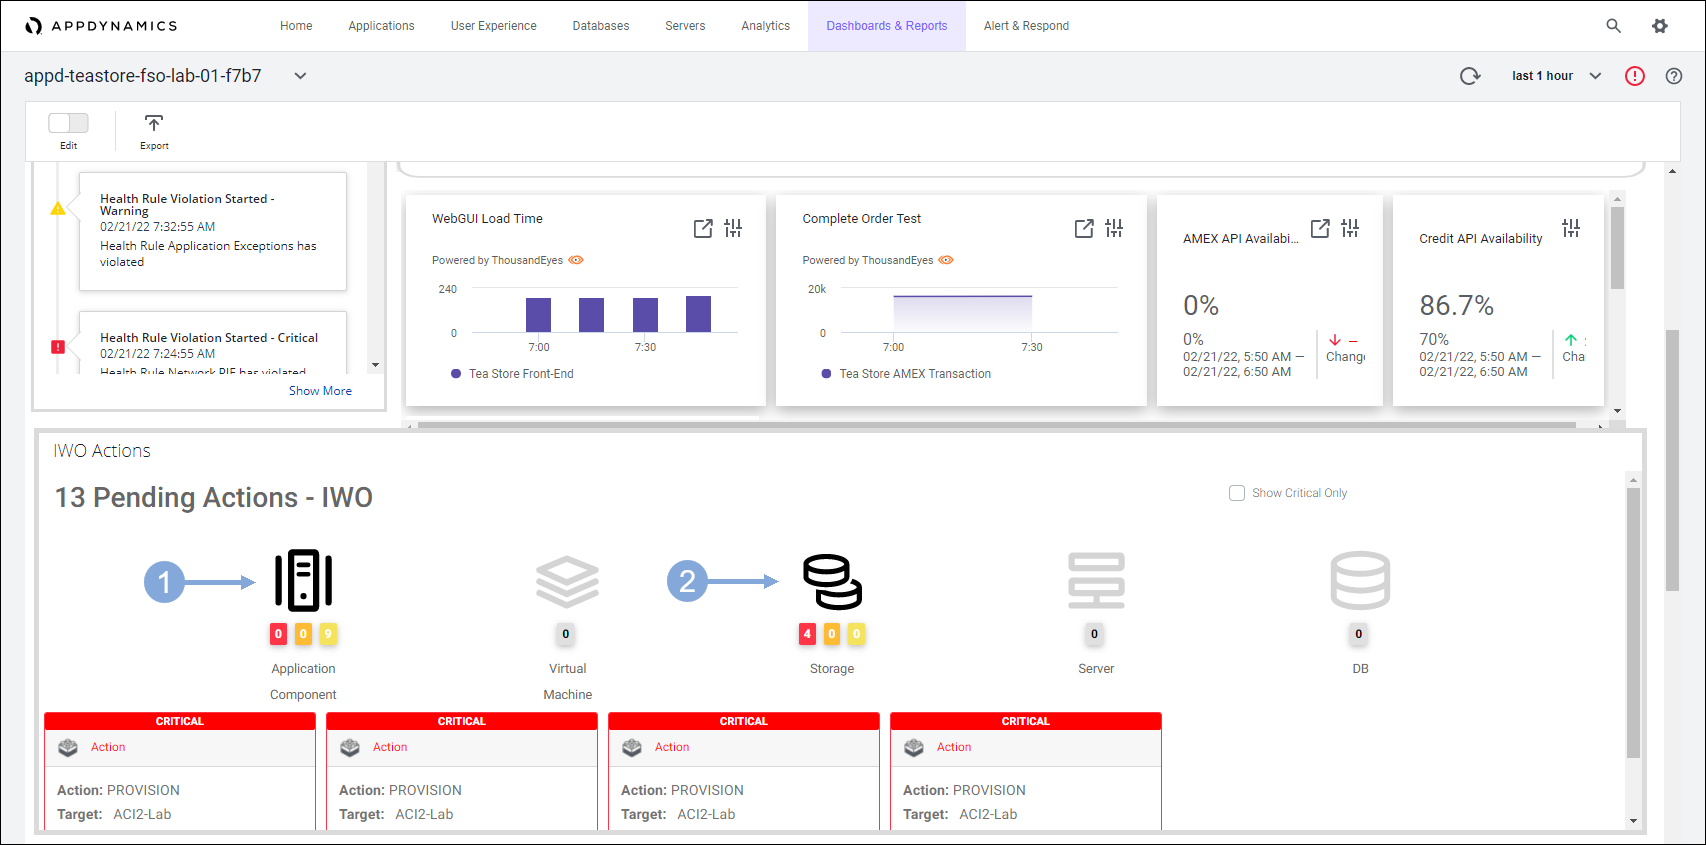
IWO Pending Actions
Scroll to the Pending Actions - IWO section.
These are recommendations to improve the performance or efficiency of the infrastructure that supports the application pulled in from Intersight Workload Optimizer.
If your dashboard is not showing the IWO components, go to your Cloud9 terminal and restart the IWO Action Integration application using the commands below.
cd /home/ec2-user/iwo-action-integration

npm start
Use the steps below to explore the IWO pending actions on the dashboard.
- Click on the first component that shows pending actions to see the details of the recommended actions
- Click on the second component that shows pending actions to see the details of the recommended actions
Next, you will take a look at the application components and their health.
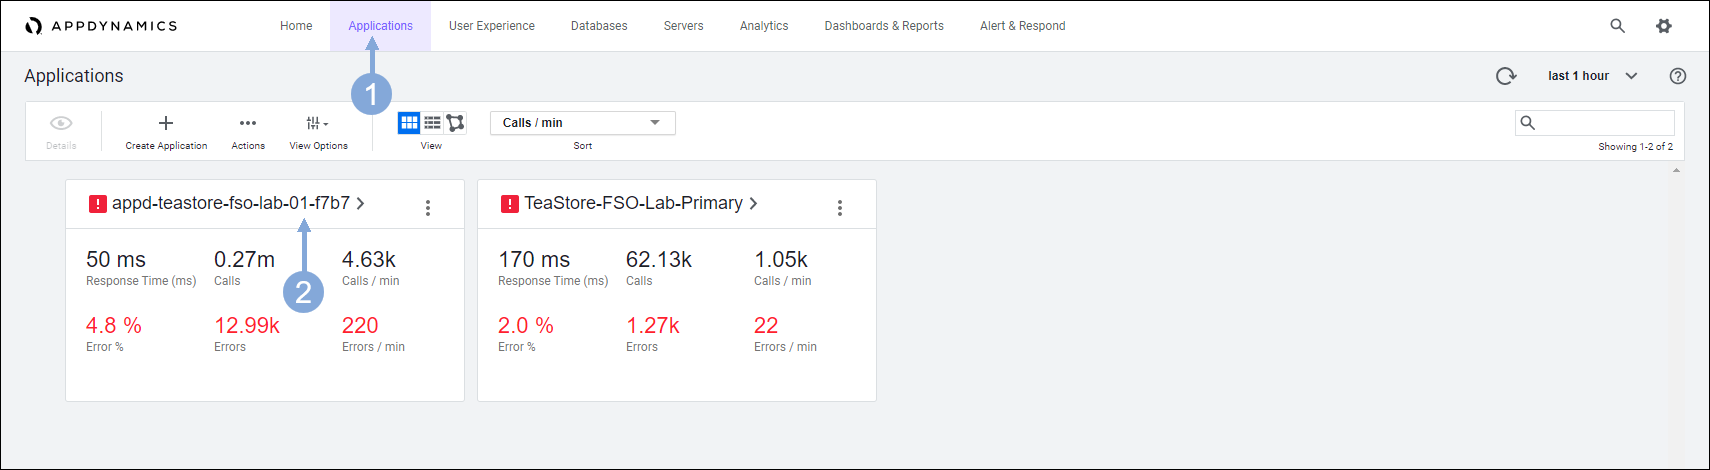
Application Dashboard
Use the steps below to navigate to your TeaStore application.
- Click on the Applications tab on the top menu
- Find your TeaStore application with your lab number in the name and click on its name to open it
The Application Dashboard displays showing the components that comprise the TeaStore application.
- The highlighted nodes at the top of the flow map are the third-party applications that process the payments
- You can ungroup the 2 HTTP backends using the steps outlined here if they are grouped together
- The highlighted nodes at the bottom are the on-premises portions of the infrastructure
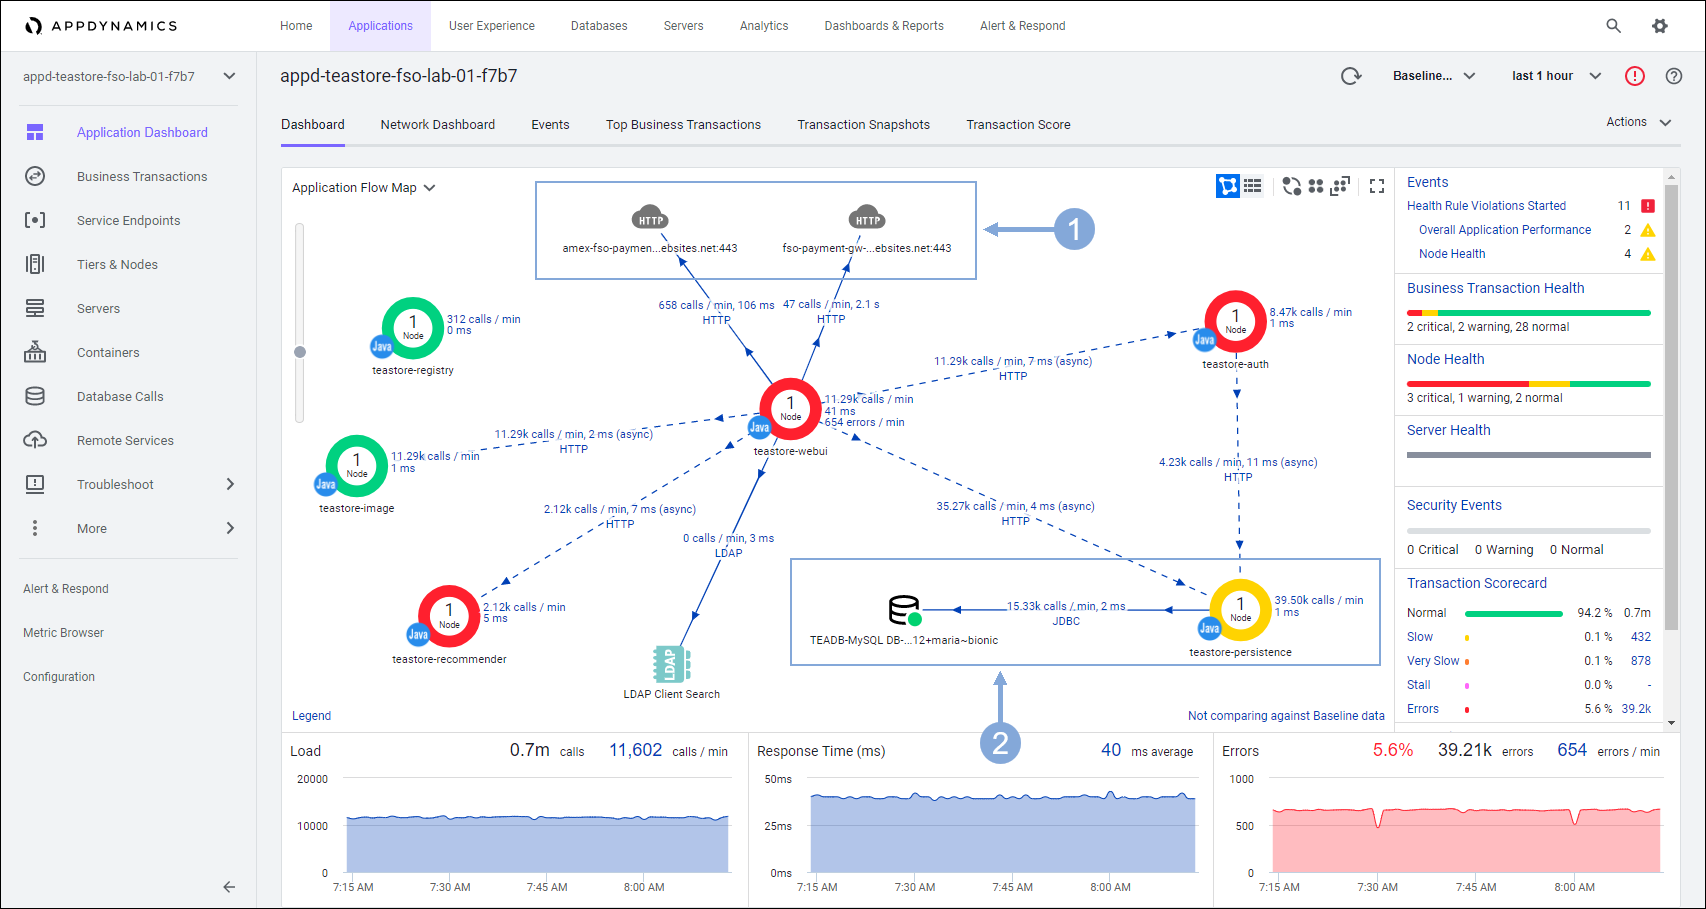
When you open the flow map for the application, you see all the application components appear like in the image above. Flow maps present a dynamic visual topology of the components and activities of your monitored application environment in direct context of the time frame you have selected.
AppDynamics APM agents automatically discover the components, frameworks, services, and dependencies that make up the application. Using intelligent automatic detection, agents collect application data and metrics to build flow maps. AppDynamics automatically captures and scores every transaction.
Next
We’ll look at how AppDynamics provides visibility into the infrastructure inter-dependencies with Cloud Native Application Monitoring.